The surveys on the subject of commodities undertaken in 1994 and 1995 (which are in the process of being updated for the Ile-de-France and Bordeaux regions) have highlighted the link between economic activities and the deliveries/collections that they generate. As a result, it has come to light that a pharmacy generates more comings and goings than a restaurant, using different kinds of vehicle, and that the service sector generates traffic, etc...
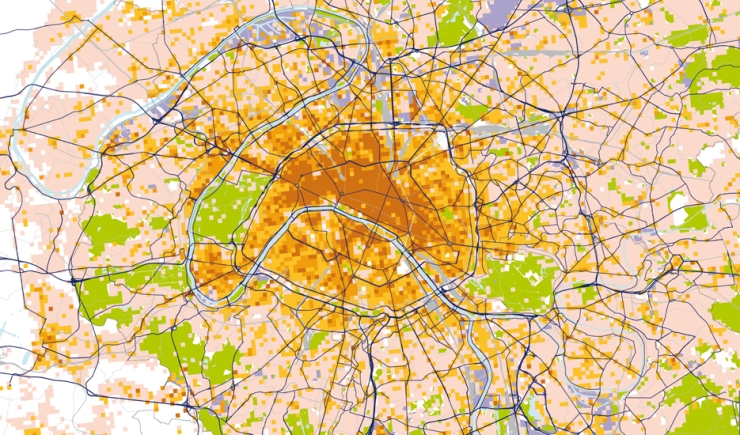
Using data from the SIRENE °° file, FRETURB, developed by the LET°, makes it possible to assess the number of ‘movements of goods’ over a particular period and geographic sector. One ‘movement of goods’ corresponds to a stop by a vehicle for delivery or collection, whatever the type of vehicle. (HGV, vans but also light goods vehicles or 2-wheel drive).
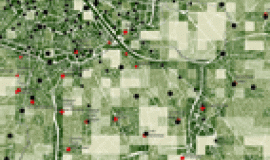
The map represents an assessment of all the logistical activity in the department, expressed by number of weekly trips represented on a grid 200 m by 200 m.
° : Economy and Transport Laboratory based in Lyon.
°° : INSEE file of economic establishments and administrations with type of activity and number of employees.
This map has been extracted from the study The road network at the heart of the conurbation – Phase 1: shared diagnosis undertaken by Apur together with the Ile-de-France Regional and Inter-departmental Authority for Amenities and Development – DRIEA -, the Public Transport Company – la Société du Grand Paris -, the town councils of Val-de-Marne and Seine-Saint-Denis, the City of Paris, and with the support of the General Council of Hauts-de-Seine and the Ile-de-France Public Transport Authority -STIF-.

