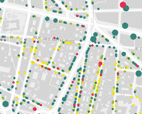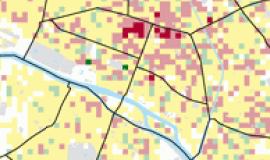
Within the framework of its “commercial diagnostic of Paris”, the Paris Urbanism Agency has put together an interactive cartography showing the number, structure and developments in shops and commercial services in each Parisian district.
This work has been carried out in partnership with the Paris Chamber of Commerce and Industry and is based on the business databank, the « BDcom », updated regularly through surveys carried out every three years, the most recent of which dates from 2014. This database can be consulted directly on the Apur website via the link https://www.apur.org/article/datavisualisation-fiches-commerciales
The interactive map in question allows one to choose a district, to zoom in and out at will, to select different types of shop (food, non-food, restaurants and cafes, commercial services, vacant premises and other kinds of premises). It also gives access to files which show in particular:
- key figures (number of shops out of premises counted, commercial density per 100m of street, density per 1,000 inhabitants)
- changes in businesses between 2000 and 2014 by type of shop or service
- a comparison of changes in shops and commercial services, in jobs and in population between 2006 and 2014.
This ergonomic and interactive representation method is a new tool for getting a picture of businesses in Paris, useful both for the inhabitants of Paris and key players in the economy.
Press contact : Renaud Paque
01 42 76 21 59


